Exposure in QGIS
Add the exposure model to a map
The first step is to create a database connection inside QGIS. Right click on the SpatiaLite
inside the Browser panel. Select the SQLite database file that you have downloaded and want
to connect to.
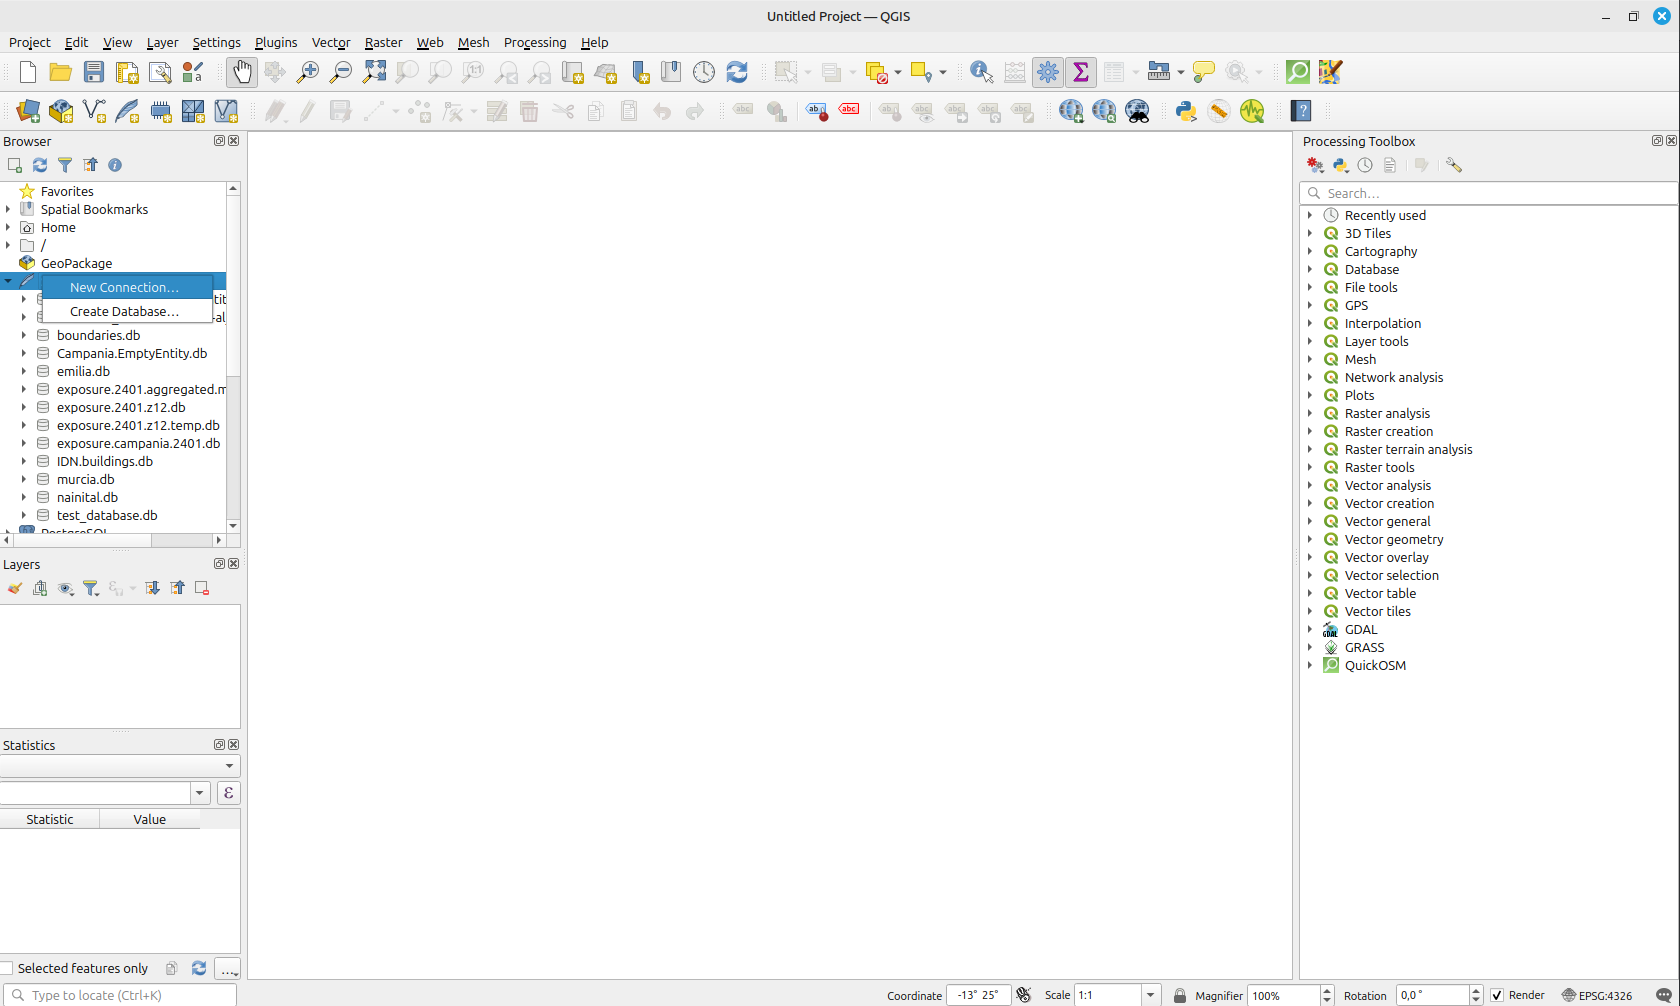
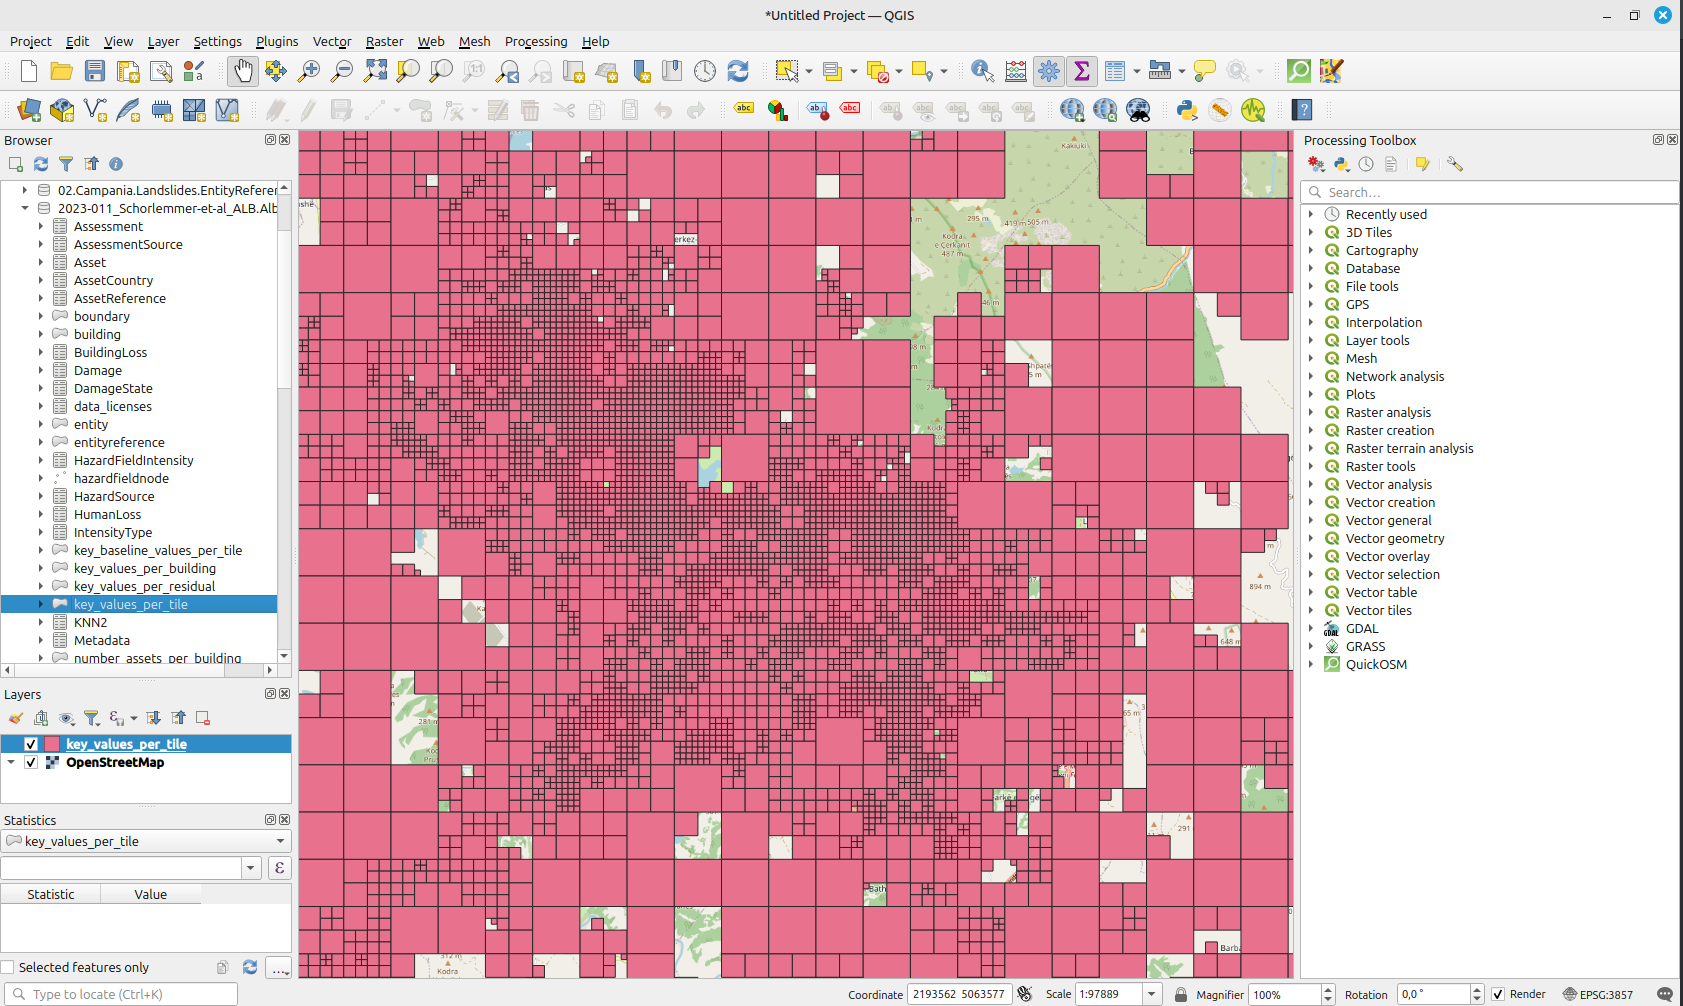
Now you can open the connection and add elements to the map. One could add a complex SQL query
that joins the entity and asset tables to the view, but there are already pre-existing views
that do that for you. We can select the key_values_per_tile, that sums all asset values within
one tile together (the number of buildings, the population at night and the total structural value).
If the database is very big, it is suggested to first zoom to the area of interest and afterwards
add the layer to the map by double-clicking.
Create a map color by population value
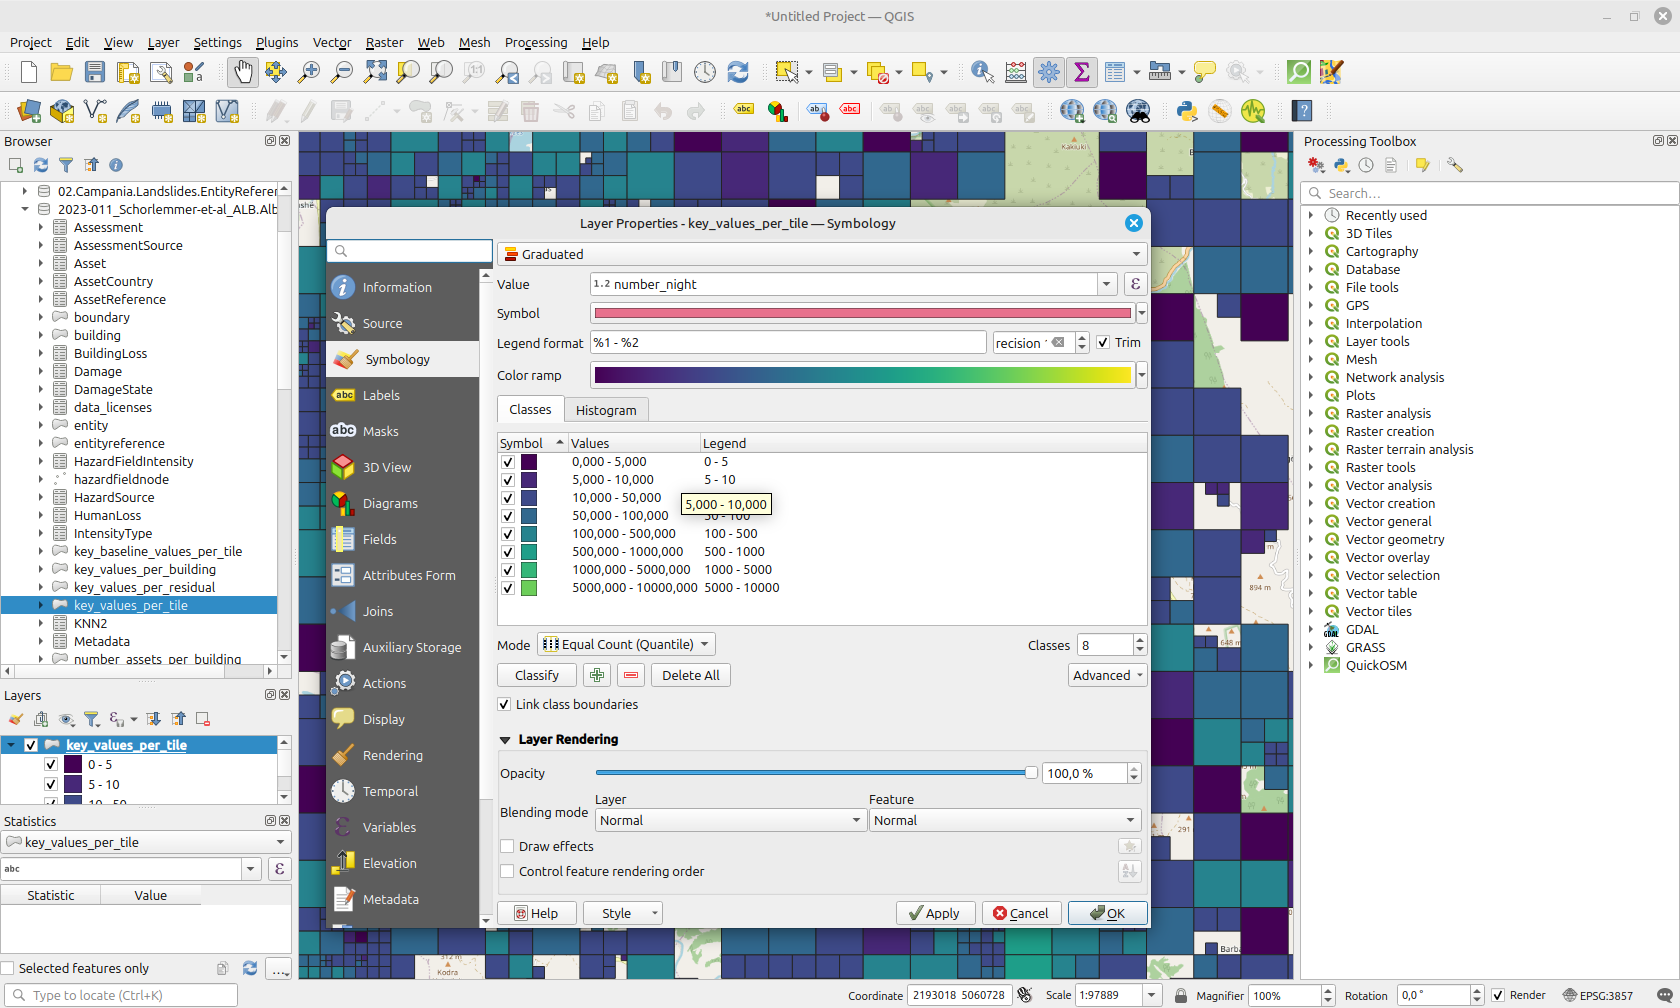
Now the layer is added to the map, we can create some symbology. Double-click on the layer inside
the Layers panel to open the Symbols panel. Here, we can add a graduated symbol
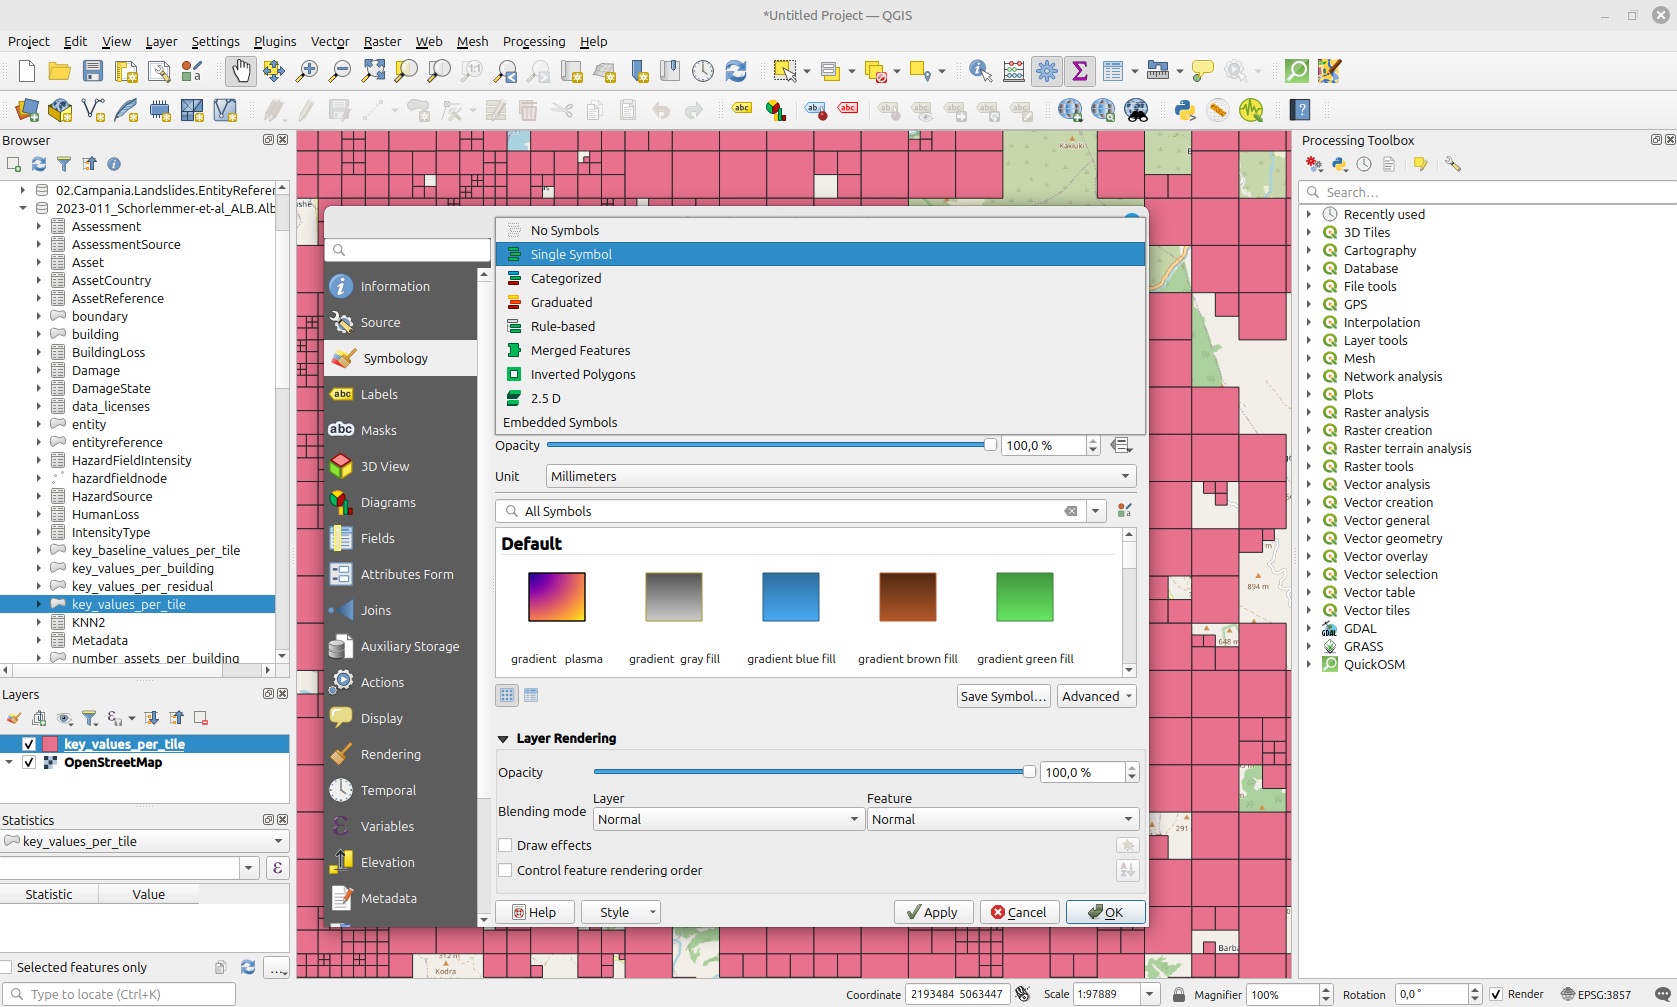
This opens a menu with some options. We can select a value to colour by. In this case, we select
the number_night column to show the total population at night per tile. Click on Classify for
an automatic creation of the classes, or add the separate classes manually (as we did in the image below).
We also have selected the Viridis colour ramp instead of the default one.
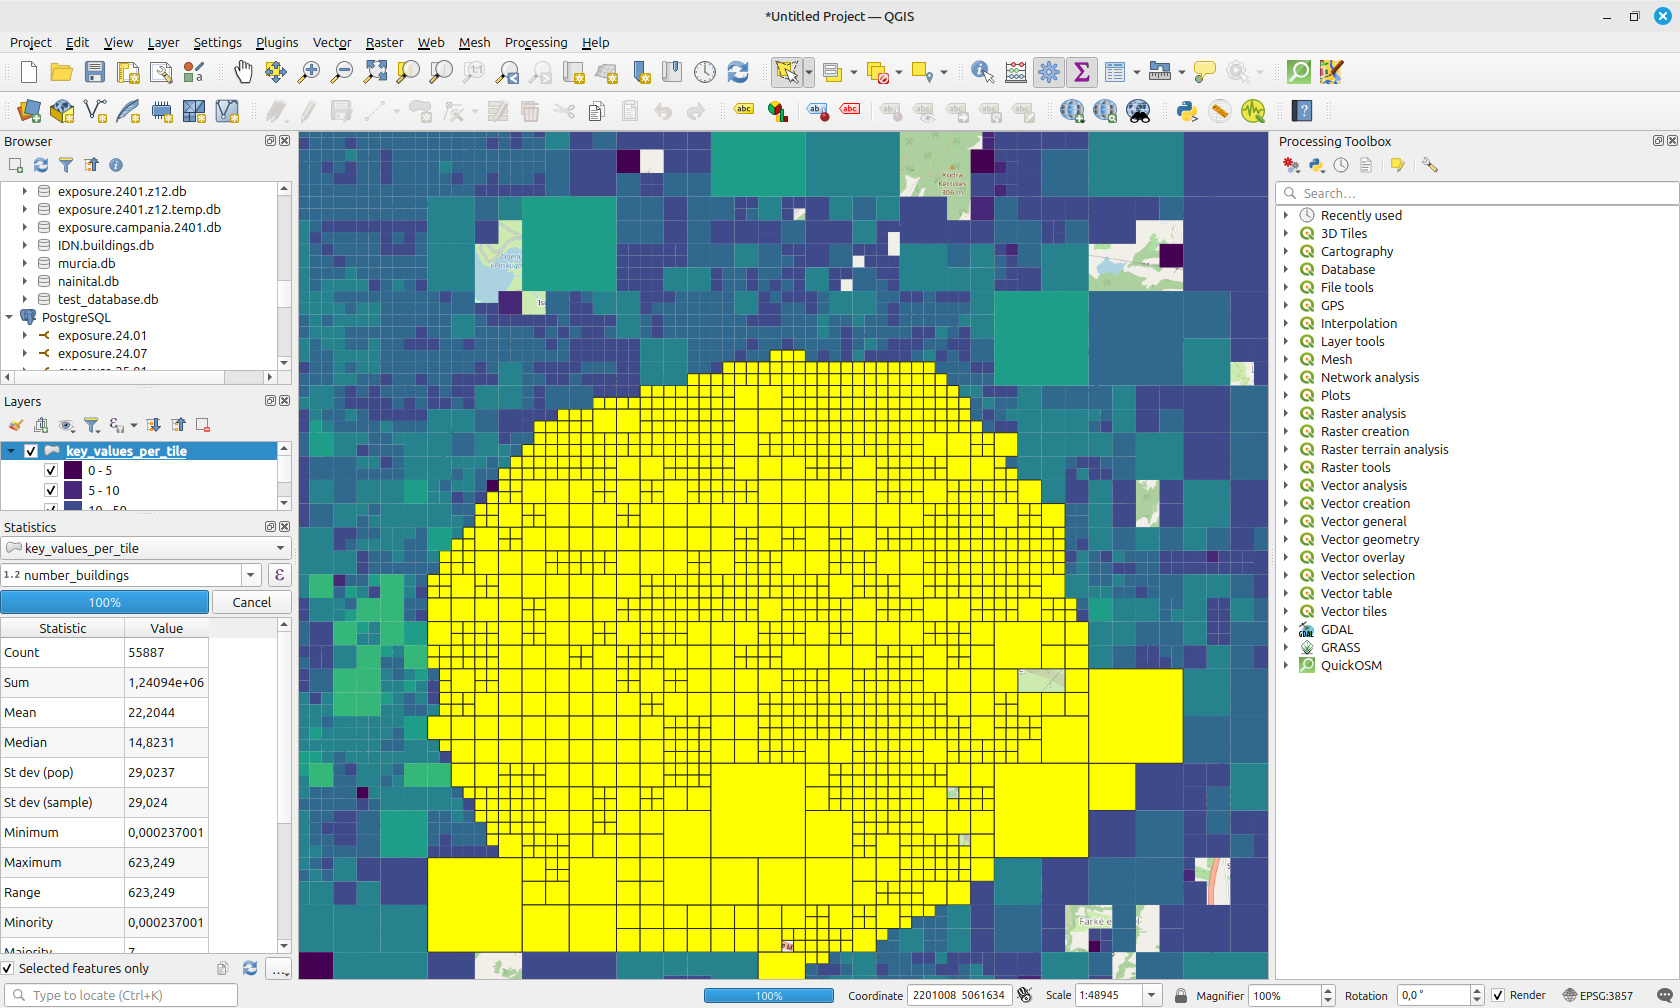
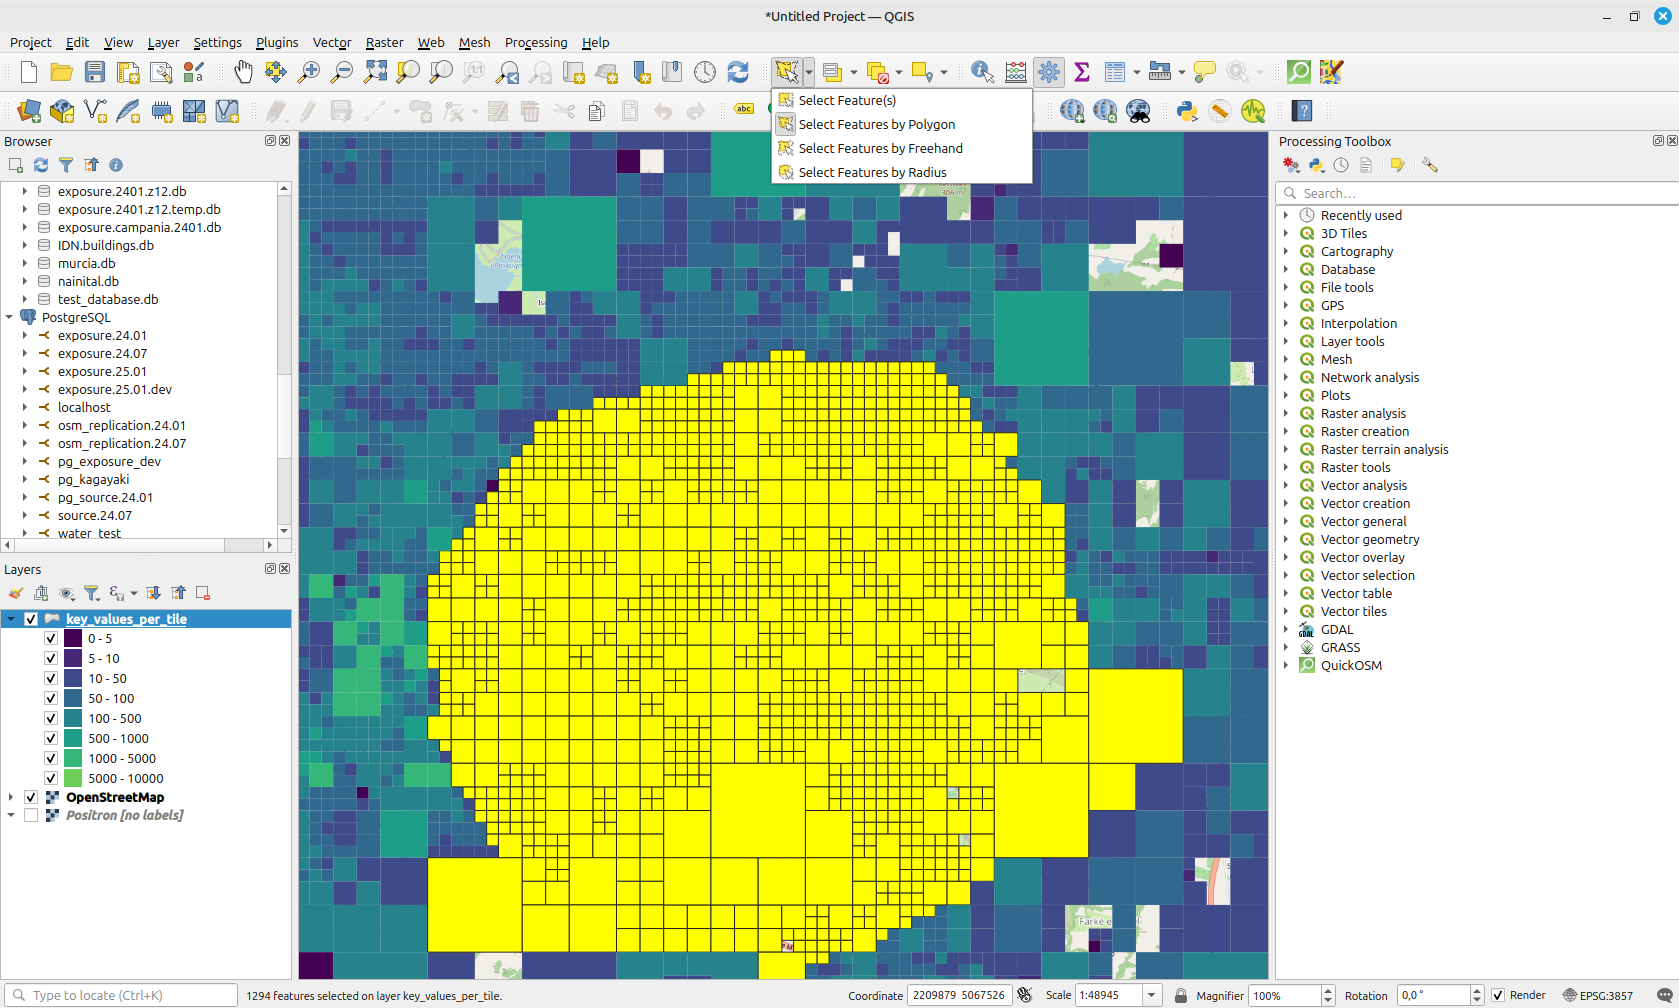
Calculate simple statistics
We can calculate some rough statistics, by selecting features. You can select features by bounding box, or by polygon.
Now we can open the Statistics panel (the Σ symbol found in the top bar). Here, we should
select the layer key_values_per_tile and make sure that we select the Selected features only
option. Then, we can select a column to calculate the statistics on, in this case the number_night
column.