Publications and presentations about GDE
Details
The location and type of buildings are incredibly useful data in any phase of the disaster management cycle. During the prevention and preparedness phases, the exposure and vulnerability of the population to natural hazards can be identified, using building inventories. To get to know the extent of damage in the recovery phase, one needs to know the state of the buildings before the disaster. In the response phase, knowledge about the exact population distribution can prove crucial. This can be derived from the knowledge of building locations and how and when they are populated. The common spots for shelter, such as hospitals and schools, should be identified immediately after a disaster has struck. Humanitarian mapping has been a key support for disaster relief. Usually, the mapping is channeled through OpenStreetMap (OSM). By MapSwipe and automated completeness assessments it can quickly become clear where data is lacking. Volunteers often map areas through Mapathons organized by the Humanitarian OpenStreetMap Team (HOT) or Missing Maps. It is partly per these endeavors that OSM contains almost 600 million buildings as of 1 January 2024. Recently, datasets using AI methods, largely based on Earth Observation (EO) data have been created to identify the world’s buildings. The Google Open Buildings dataset, the Microsoft Global ML Building Footprints contain semi-automatically generated building footprints. Both are of near-global extent and they contain respectively 1.8 and 1.3 billion buildings, but neither is fully complete. Unfortunately, unlike OSM, these datasets lack building attributes. The Microsoft dataset does include height in some limited areas, such as the USA and parts of Europe. There are datasets that contain more information, but they span a much smaller area. For example the USA Structures dataset defines occupancy types of buildings based on land use. However, in an ideal situation the rich information structure found in OSM is combined with the extensiveness of building footprints from the EO-derived datasets. We investigated the wide range of features and attributes available from OSM, such as land use, amenities and points of interest and used these to classify all building footprints found in OSM itself and the EO-derived Google and Microsoft datasets. This resulted in three datasets of together 3.7 billion buildings. However, many of these buildings are overlapping. Therefore, a grid has been established on a resolution of roughly 100x100 meter. Each tile in the grid contains buildings exclusively from one of the three datasets, with the priorities from high to low: OSM, Google, Microsoft. If we use the quantity of the EO-derived datasets with the elaborate OSM tagging scheme, we can make better data-informed decisions during all phases of the disaster management cycle: (1) A detailed high-resolution global building inventory leads to better risk forecasting models. (2) Knowing both location and type of buildings results in a broad understanding of the common shelter spots and better estimates of the population distribution at the time of the disaster. (3) post-disaster situations can be better analyzed in scenario-based damage assessments.State of the Map 2023: A global and dynamic completeness assessment of the OpenStreetMap buildings
Details
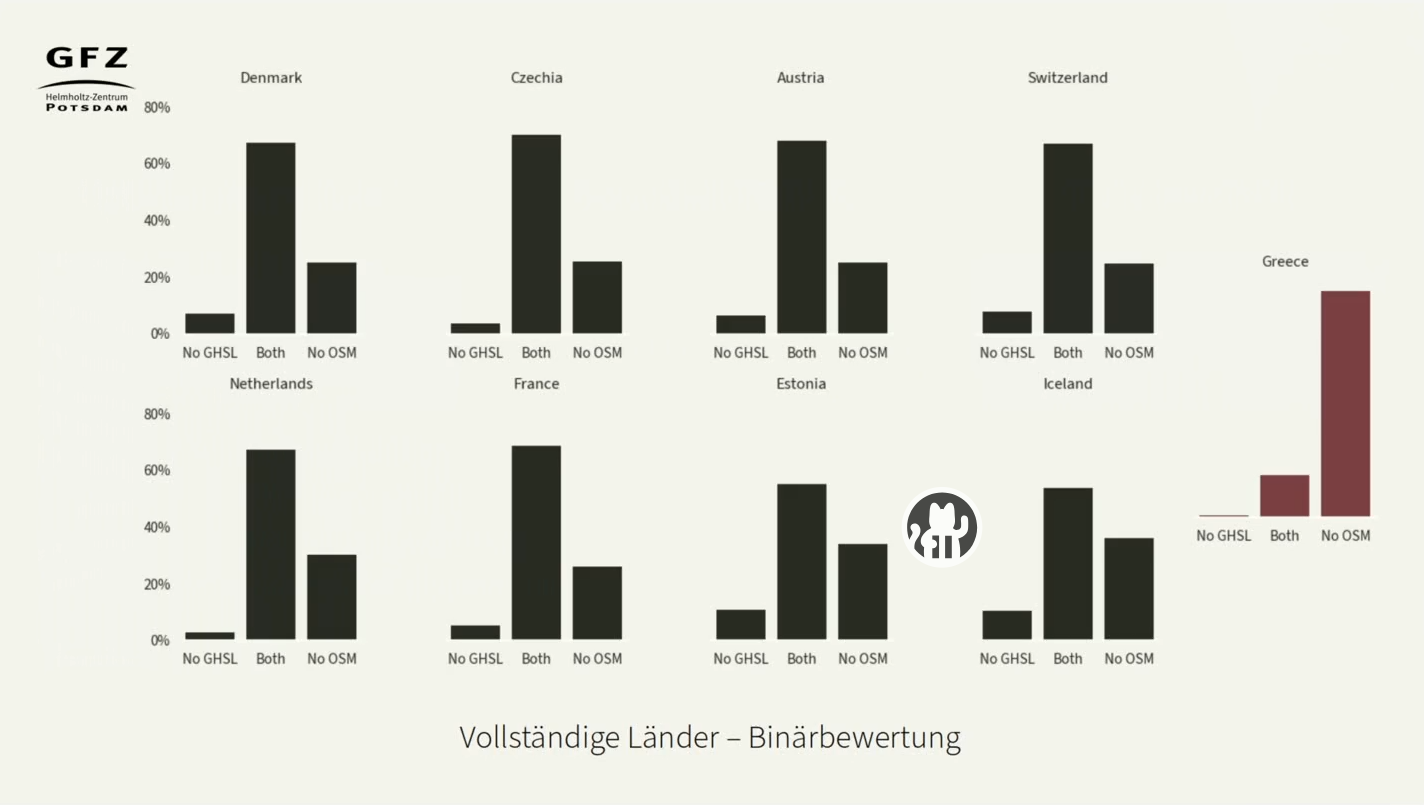
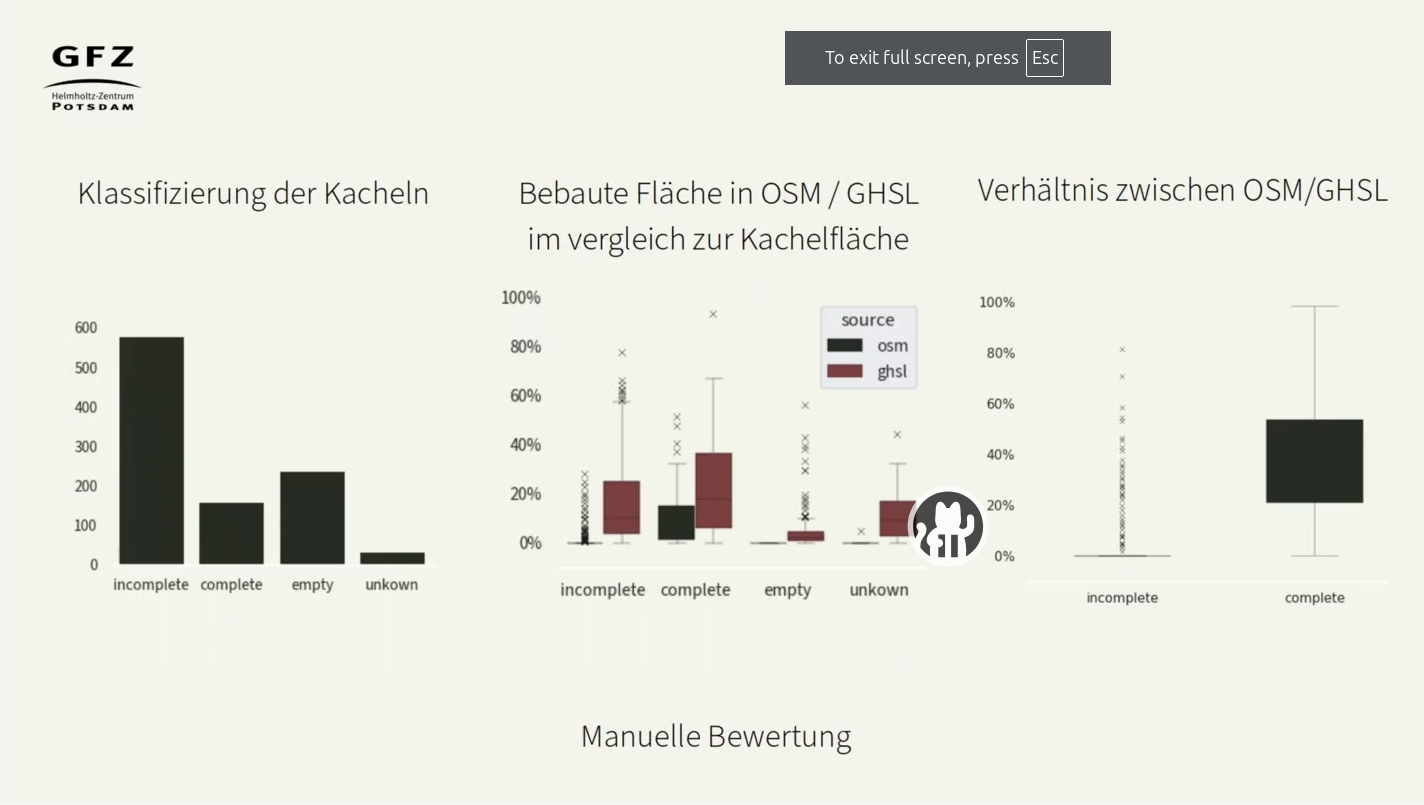
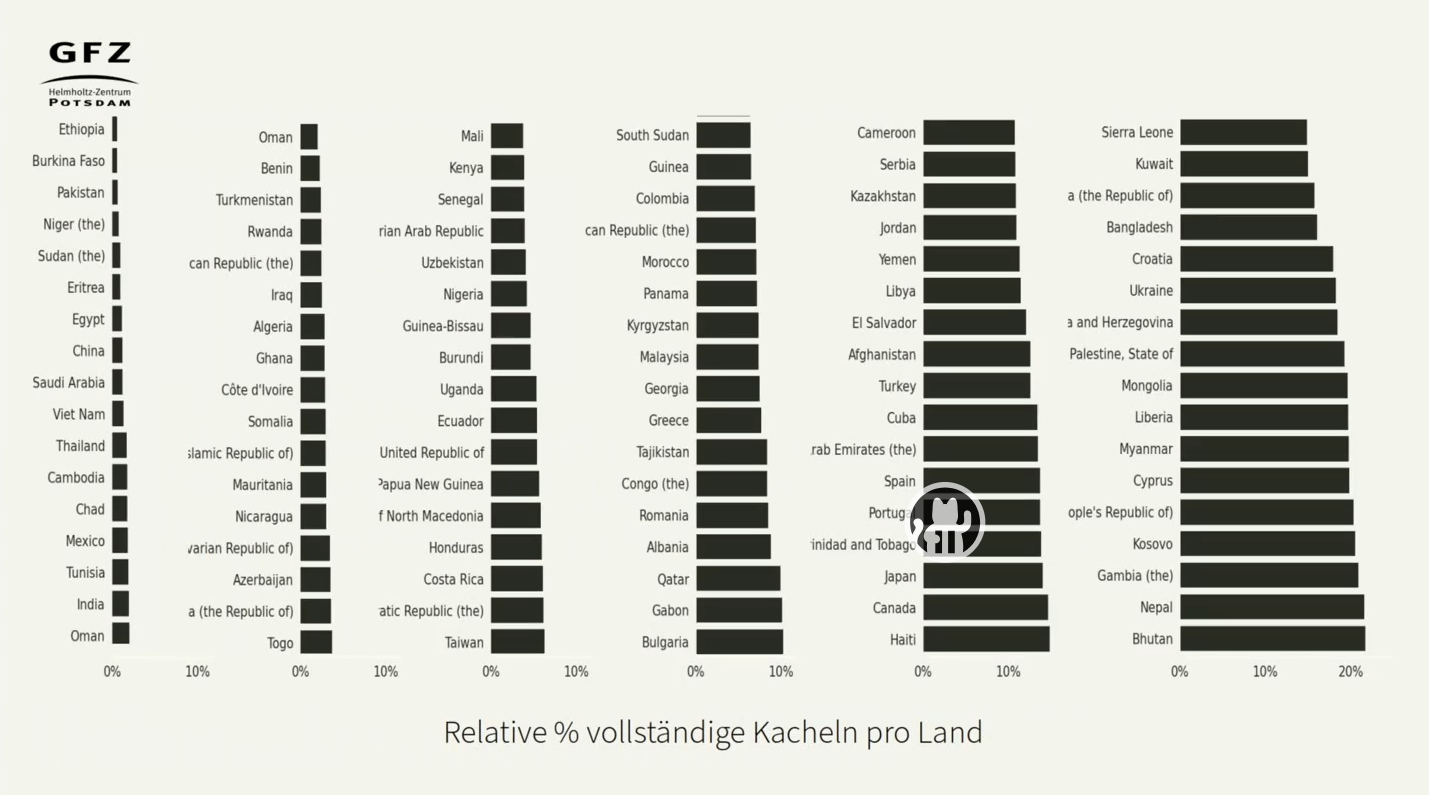
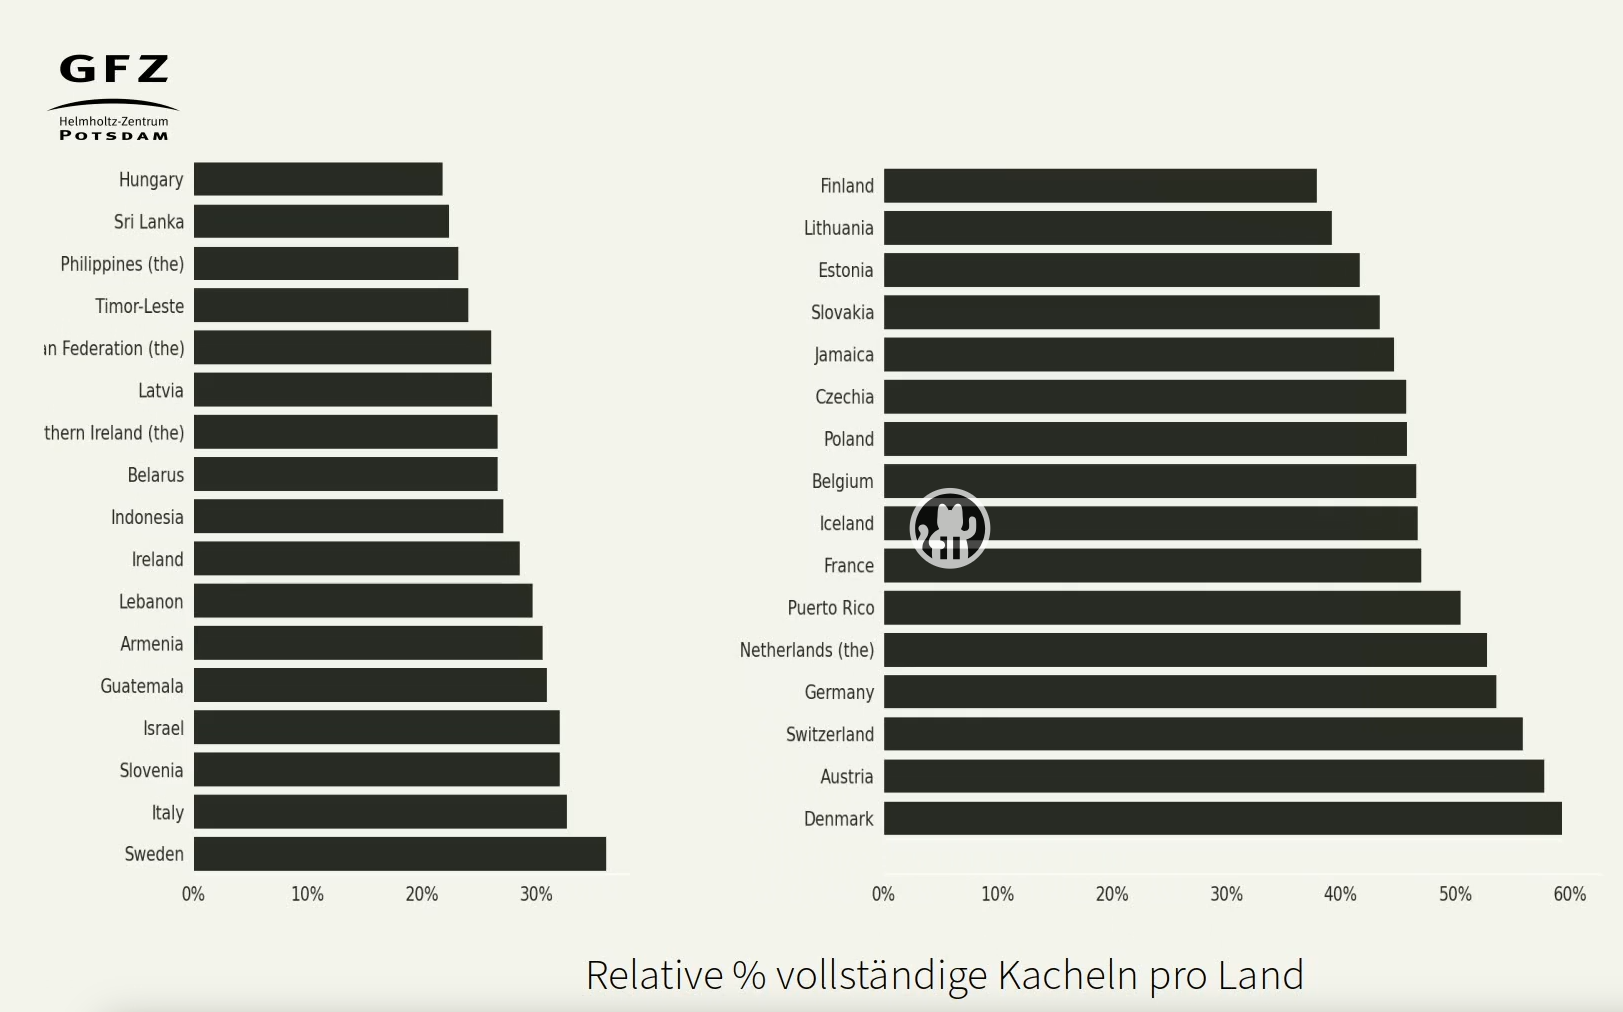
An initial state of OSM completeness was computed on an OSM planet file generated reflecting the exact building data of 1 January 2022, midnight UTC. The built area of OSM and the proxy datasets have been computed on a Quadtree grid using level-18 tiles. Their size is approximately 100x100 meters in Europe and slightly larger than 150x150 meters near the equator. As there are 64 billion of such tiles, a recursive method is used for calculation. It is initiated on a level-1 grid, which divides the world into four tiles. For each tile, it is checked whether it contains any built area and if it does, it is divided into four new tiles. This process is repeated for all resulting tiles of the next zoom level, until the level-18 has been reached. For this zoom level, the total square meter of built area within each tile is calculated for the OSM and proxy datasets. Finally, they are compared to each other to estimate the completeness. The data have been aggregated to level-15 tiles (between 800x800 and 1200x1200 meter), to examine the differences between aggregation levels. The result of the level-15 tiles can be found in Figure 1. Figure 1. Building completeness of OSM on 1 January 2023, aggregated onto zoom-level-13 Quadkey tiles. We have identified a list of countries (e.g. France; the Netherlands; Denmark) that we consider to be complete, partly through knowledge of imports and partly through our own judgment. For these countries we assessed the accuracy of the completeness assessment using the GHSL dataset and we found that the level-15 tiles were more reliable to use, due to the quality of the data in the proxy dataset. As the GHSL dataset has a resolution of 10x10 meter pixels, it is not as detailed as the OSM buildings. Therefore, not only is there a consistent overestimation of built area in the proxy dataset, there may also be false positive built area in some tiles. A level-15 resolution provides a less precise assessment, but a better result. Therefore there is a trade-off between accuracy and precision, where at a larger scale the level-15 assessment is preferred, while at a smaller scale (e.g. a city), the grid of ~1x1 kilometer is a bit coarse. Unfortunately, none of the countries within the coverage of the Google dataset are considered complete in OSM, therefore such validation of the results cannot be made. Building changes are detected on a minute-by-minute basis. A change in a building geometry triggers a recalculation of the built area of the tile(s) intersecting the building. Also the comparison between the proxy dataset and the building dataset is recalculated. In this way, each change to buildings in OSM is detected and processed to produce a completeness map that is always up-to-date with the latest changes. The project was built using the Overpass API [14], with the augmented diffs tracking the minutely changes. The Osmium tool [15] has been used to replicate the complete OSM building dataset, for fast processing.FOSSGIS 2023: Vollständigkeitsabschätzung von Gebäuden in OSM mit dem Global Human Settlement Layer
Details
Publications and presentations using GDE
Earth's Future 2024: Effective Adaptation Options to Alleviate Nuisance Flooding in Coastal Megacities—Learning From Ho Chi Minh City, Vietnam
State of the Map 2023: Improving the accuracy of earthquake risk estimates with OpenStreetMap building data
EGU 2023: ‘risk-calculator’: a tool for multi-hazard risk assessments