Exposure in QGIS
Add the exposure model to a map
Create a database connection inside QGIS: right-click on SpatiaLite in the
Browser panel and select the .db file you downloaded.
The exposure data lives across three tables — entities, entity_assets
and assets — rather than one flat table, so a simple query needs to join
across them to get to a per-tile value. Open the DB Manager (or the
provider's Execute SQL tab) and run a query along these lines, then load
the result as a layer:
SELECT
    e.id,
    e.quadkey,
    e.geometry,
    SUM(ea.number * ea.relative_size * CAST(json_extract(a.attributes, '$.OPN') AS REAL)) AS number_night
FROM entities e
INNER JOIN entity_assets ea ON ea.entity_id = e.id
INNER JOIN assets a ON a.id = ea.asset_id
WHERE e.category = 0  -- tile entities only
GROUP BY e.id, e.quadkey, e.geometry
If the database is very big, it is suggested to first zoom to the area of interest and afterwards add the layer to the map by double-clicking.
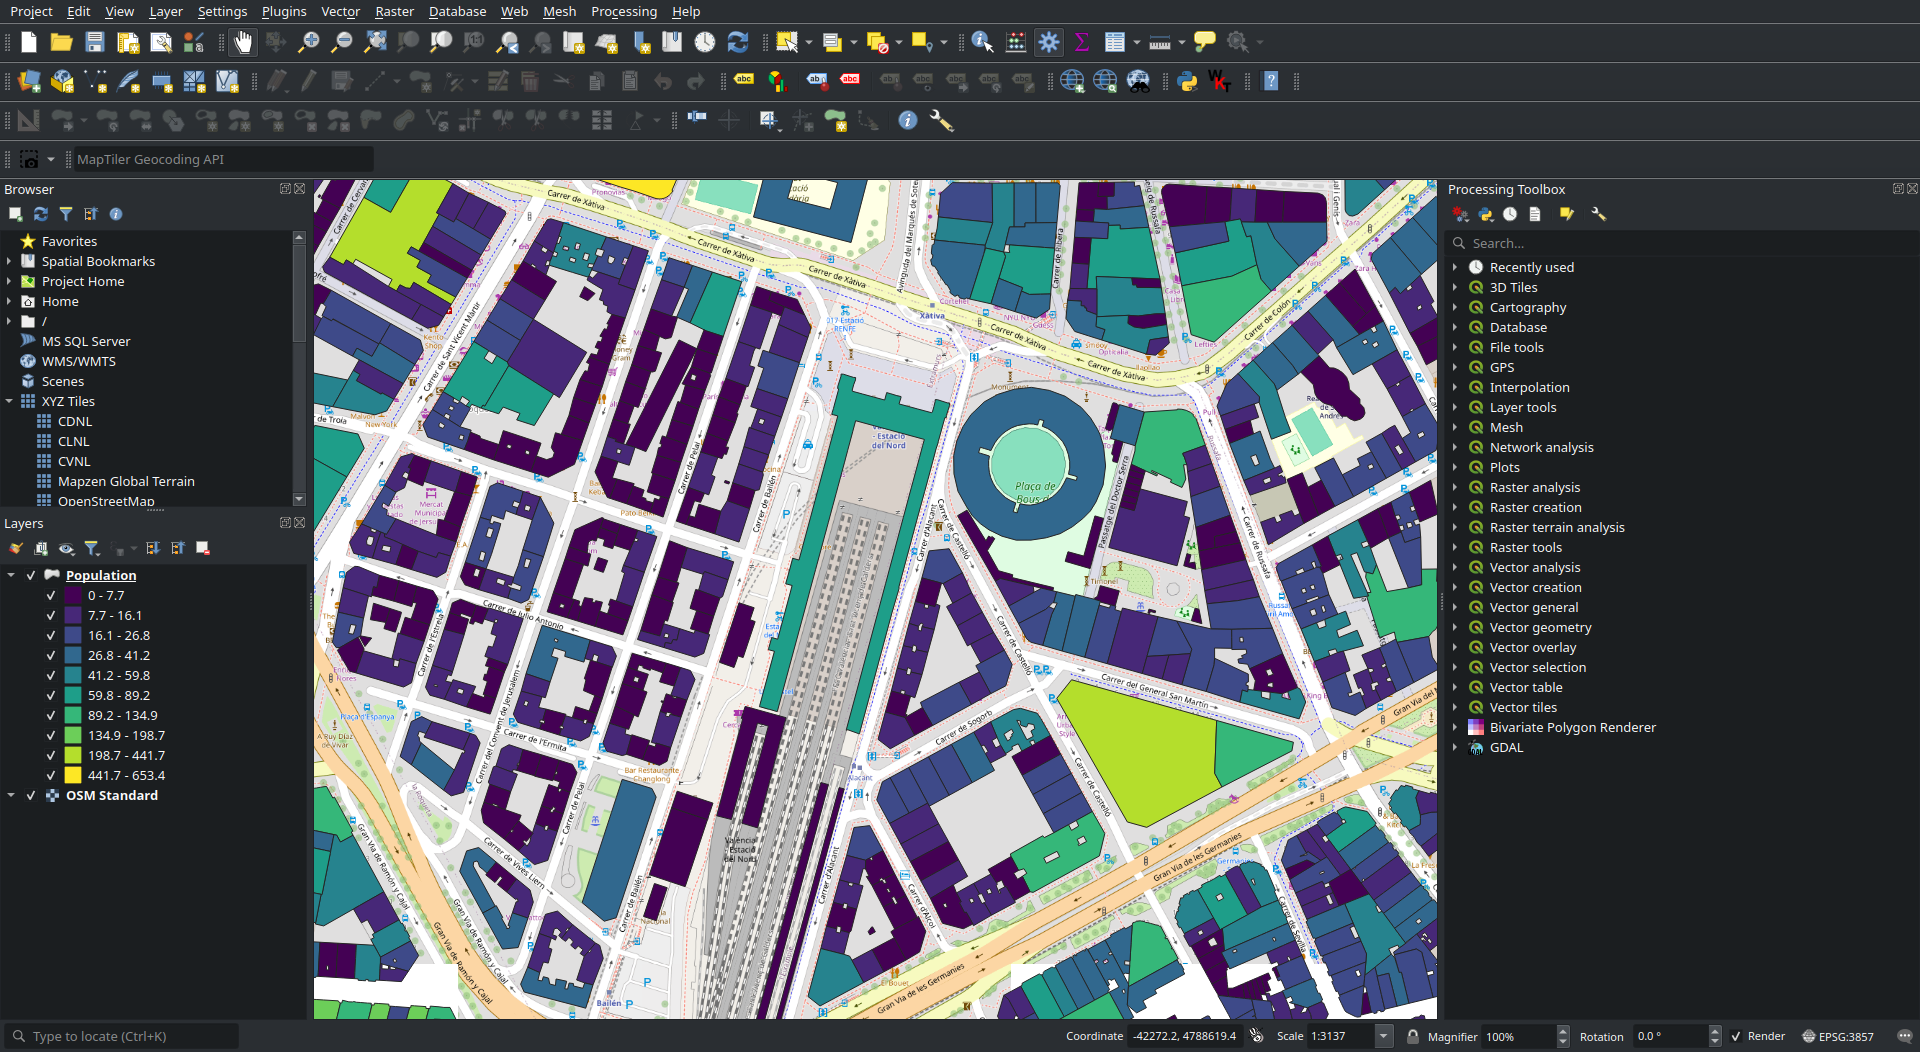
Create a map coloured by population value
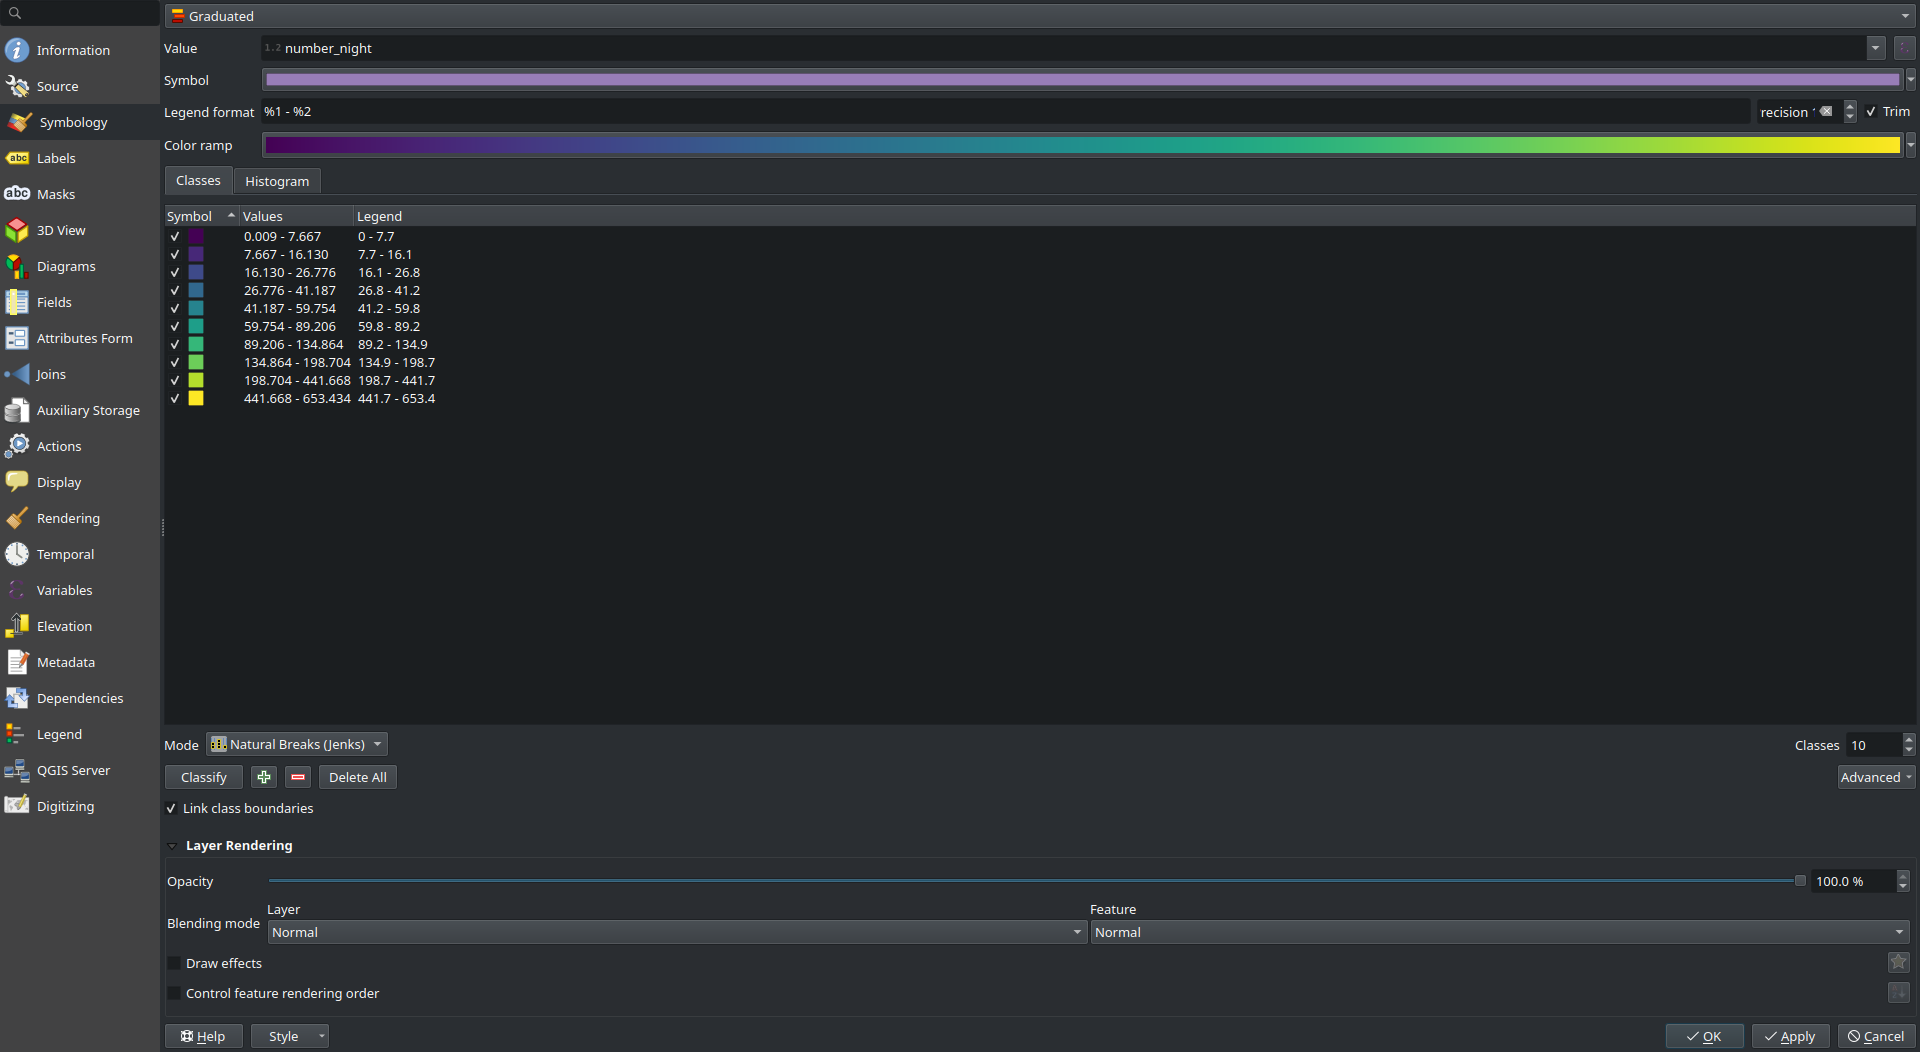
Double-click the new layer in the Layers panel to open its properties,
then switch to Symbology and choose a Graduated classification on the
number_night field. Classify generates classes automatically, or add
them manually.
Calculate simple statistics
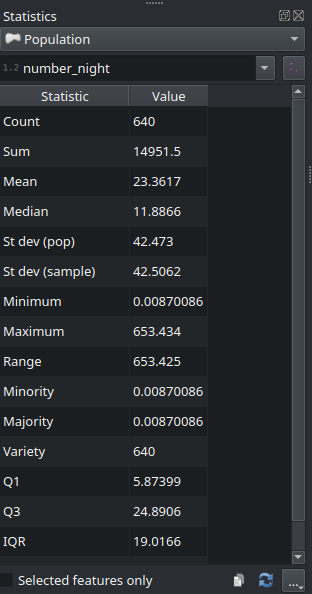
Select features by bounding box or polygon, then open the Statistics
panel (the Σ symbol in the top bar). Select the layer created above,
enable Selected features only, and choose number_night as the column to
calculate statistics on.
General information for a building
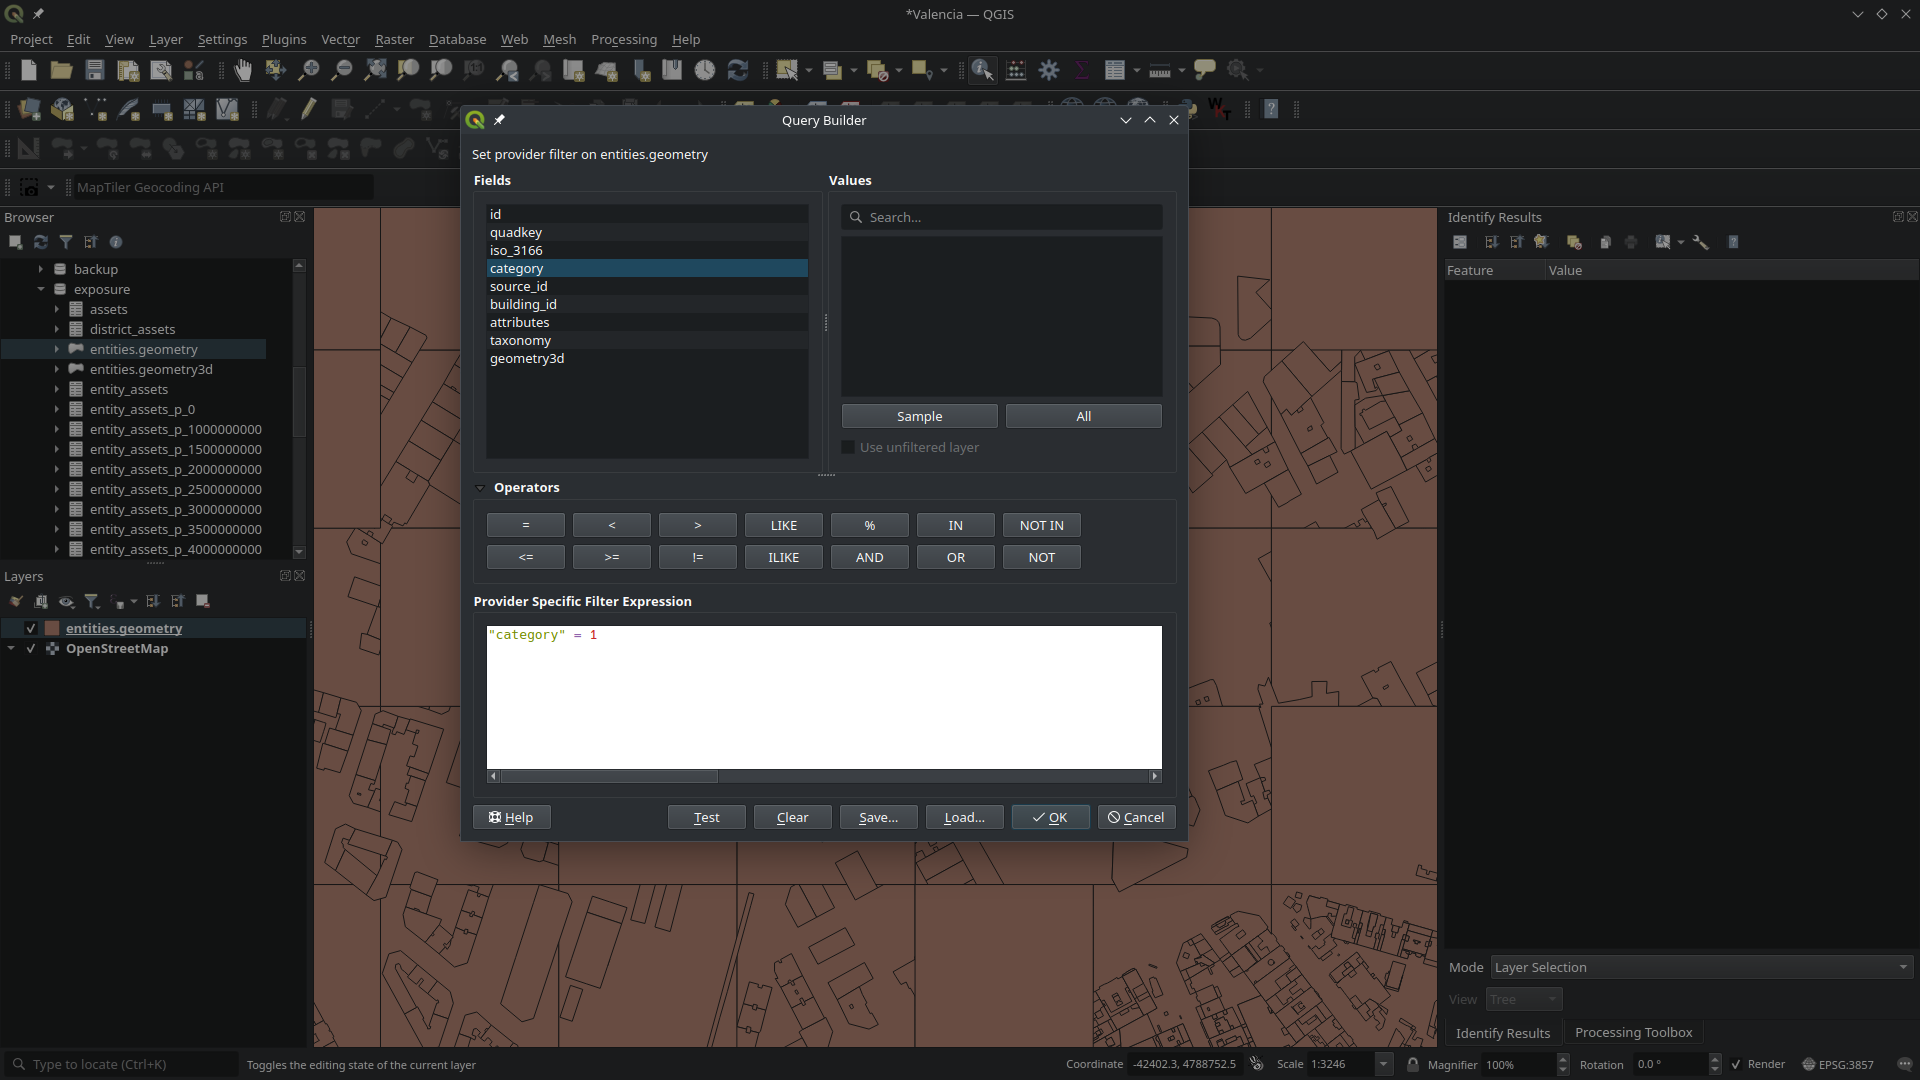
Loading the entities layer can be filtered to show only tiles
(category = 0), buildings (category = 1), building parts (category = 2),
or a combination, using QGIS's Query Builder:
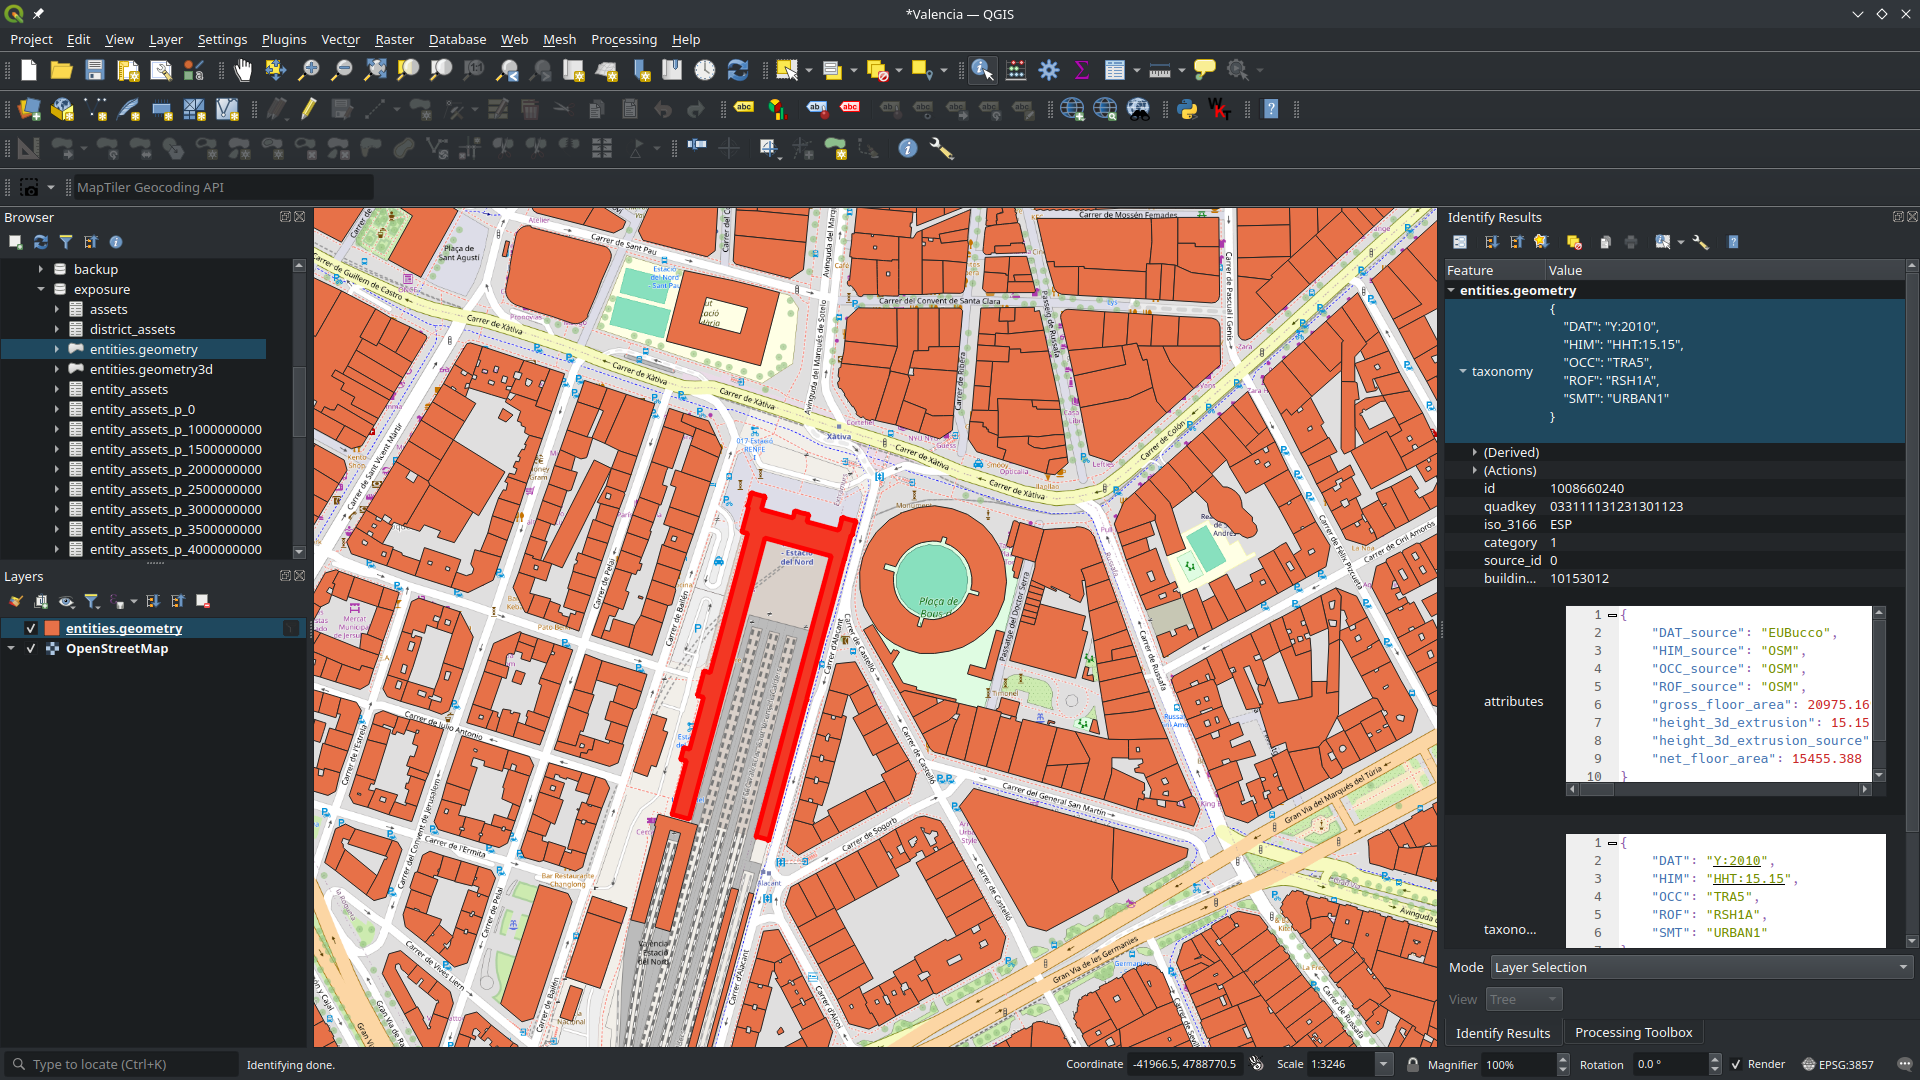
Once the wanted geometries are loaded, a building's information can be seen
with the Identify Features tool (arrow with an 'i' symbol). This shows the
attributes from the entities table directly, including the entity ID and
its attributes / taxonomy JSON fields:
For the selected building, the related rows in assets, entity_assets and
taxonomies can be queried the same way via DB Manager — see the
Database Schema for what each JSON key means.